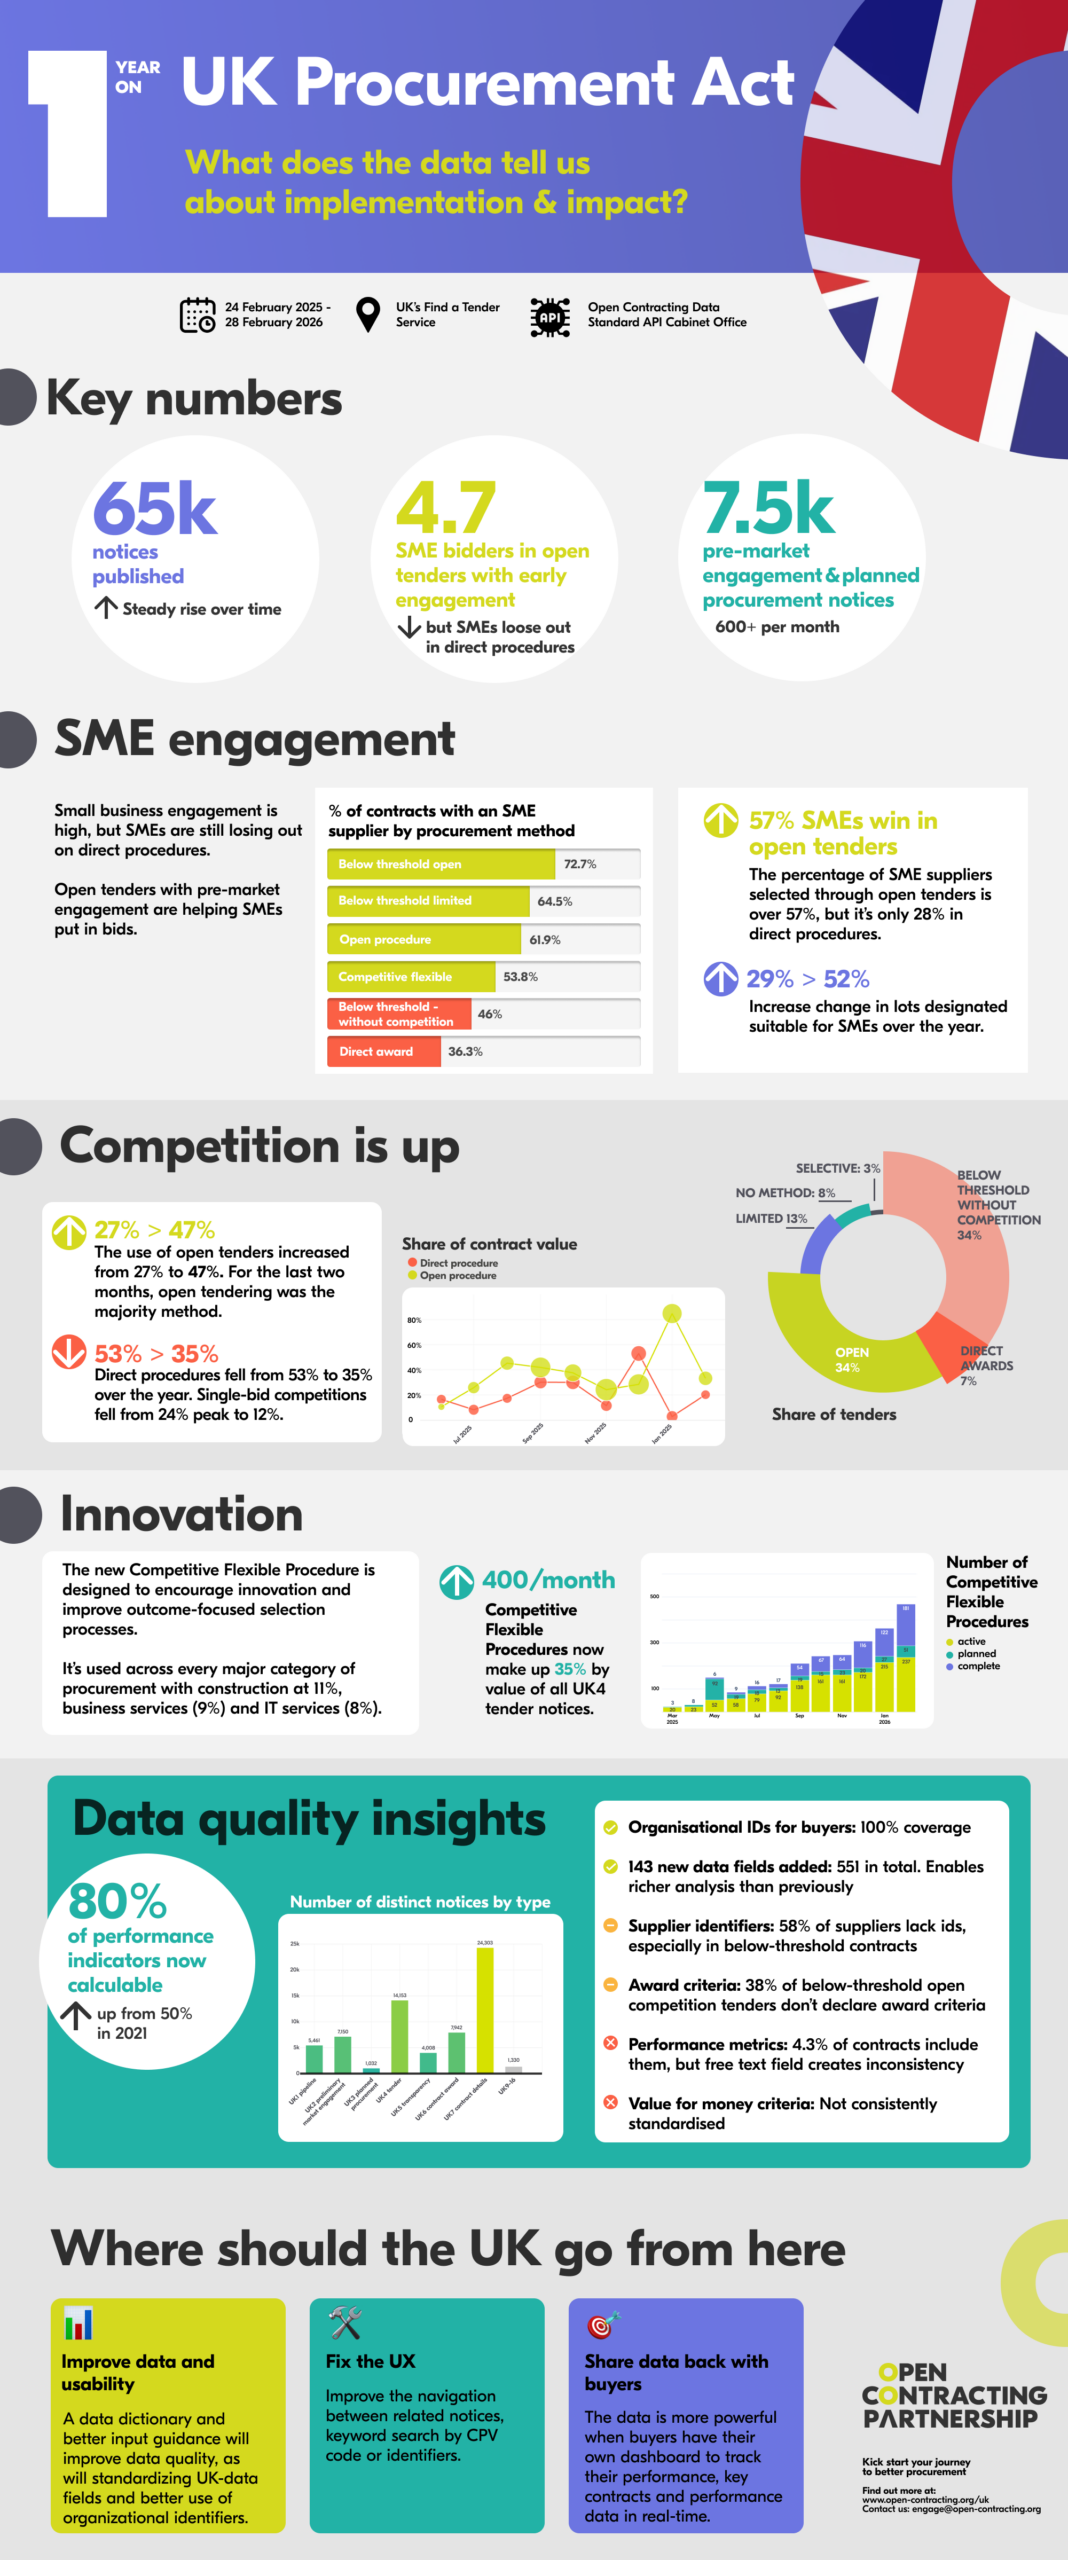
The UK Procurement Act one year on: what does the data tell us?

We’ve officially crossed the one-year mark since the UK Procurement Act from 2023 went live on 24th February 2025.
We’ve dived deep into the first year of data to explore how implementation is going and to see what it tells us about the delivery of the Act’s promise of better value for UK taxpayers, smarter public spending and easier access for small businesses.
See our methodology at the end for more information on how we calculated each metric and accessed and compiled the data from the UK’s Find a Tender Service’s Open Contracting Data Standard releases from 24 February 2025 to the end of February 2026. In our analysis, we looked at both above and below threshold procedures to get a full picture of the UK market.
Here are our key insights (also neatly summarized in this infographic):
1. A single source of truth for UK procurement – finally!
First up, let’s celebrate a major improvement in the relevance, standardisation, completeness and quality of UK procurement data.
Before the Act, tracking UK procurement was hard – a jigsaw puzzle with half the pieces missing. As the Cabinet Office itself said, the UK (like many countries) struggled with “no single picture of procurement”, with “disparate and disconnected data sets” and a lack of clear identifiers; although there was lots of “lots of data”, there was “little insight”.
The solution is a new notice regime that tracks contracts across their entire commercial lifecycle, from planning to market engagement to tendering and implementation. All these notices are collected and published for the first time on a central digital platform called Find A Tender. The notices there are structured, machine-readable and reusable under open data licences using the Open Contracting Data Standard (OCDS), enabling analysis and insight.
Importantly, suppliers and buyers alike get a standardised registration and identifier system, reducing repetition and errors. Suppliers can save and update their core business information once, then reuse it for many tenders.
While it’s still a work in progress, it means that for the first time ever, we have a clear destination to visit to explore who bought what, from whom, for how much in the UK.
2. A major improvement in data quality
For the first time, the new notices are collecting very important information to assess the overall health and performance of the UK procurement market. These include:
- SME suitability: Are these contracts actually designed for smaller players?
- Competition levels: How many bids are we actually getting per tender?
- Internal efficiency: How long does it actually take to go from “we need this” to “the contract is signed”?
- Supplier, buyer and contract IDs. Obviously, these are vital to further data analysis from following a contract in its lifecycle to understand what contracts buyers and suppliers have and in which categories.
We maintain a library of over 70 performance indicators for public procurement. We can calculate just under half of them (35) from the more limited public data under the UK’s old regime. Now we can calculate over 80% (57/71) of them, including looking at bidding patterns and other important areas for market health and competition for the first time. In our recommendations later, we point out how important it is to put this information to work now and from the UK government to offer data-driven reports and dashboards to buyers and suppliers to track contracts and find opportunities.

3. Good news on pipelines and pre-market engagement
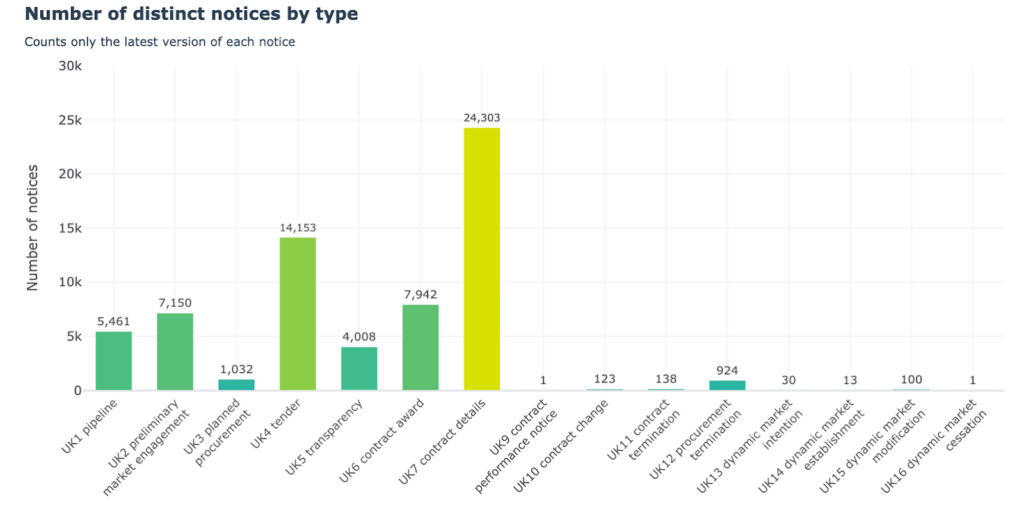
The new UK data is currently dominated by tender notices (so-called ‘UK4’ notices) and contract details notices (UK7) but a steady rise in publication of the new notices across the contract cycle – such as the new UK12 termination notice and the UK5 notice for direct awards – suggests buyers are steadily adapting to core stages of the new regime. At the very end of February 2026, we saw the first UK9 Contract Performance notice, rating a supplier against its agreed KPIs.
We are especially pleased to see increased publication of the new pipeline notices (UK1), Preliminary Market Engagement (PME) notices (UK2) and UK3 planned procurement (PPN) notices (UK3). These three notices are really important to engage diverse suppliers and find the best solutions for public needs. The new UK regime both encourages and standardises them reducing friction and administrative burden.
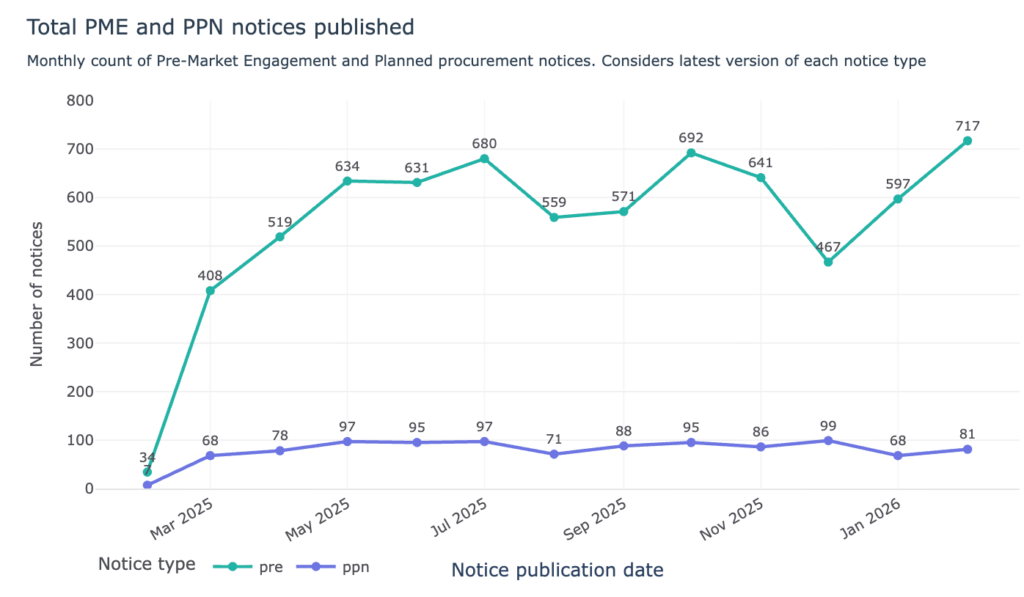
Over the past year, we see a significantly rising number of PME notices over time, with more than 600 notices now being published a month, reaching more than 700 in February. Just under a third (29%) of these are currently associated with a tender, suggesting this consultation is relatively sincere and being used well in advance of deciding what to buy.
4. UK competition: too many direct methods but open procedures increasing (and dominate by value)
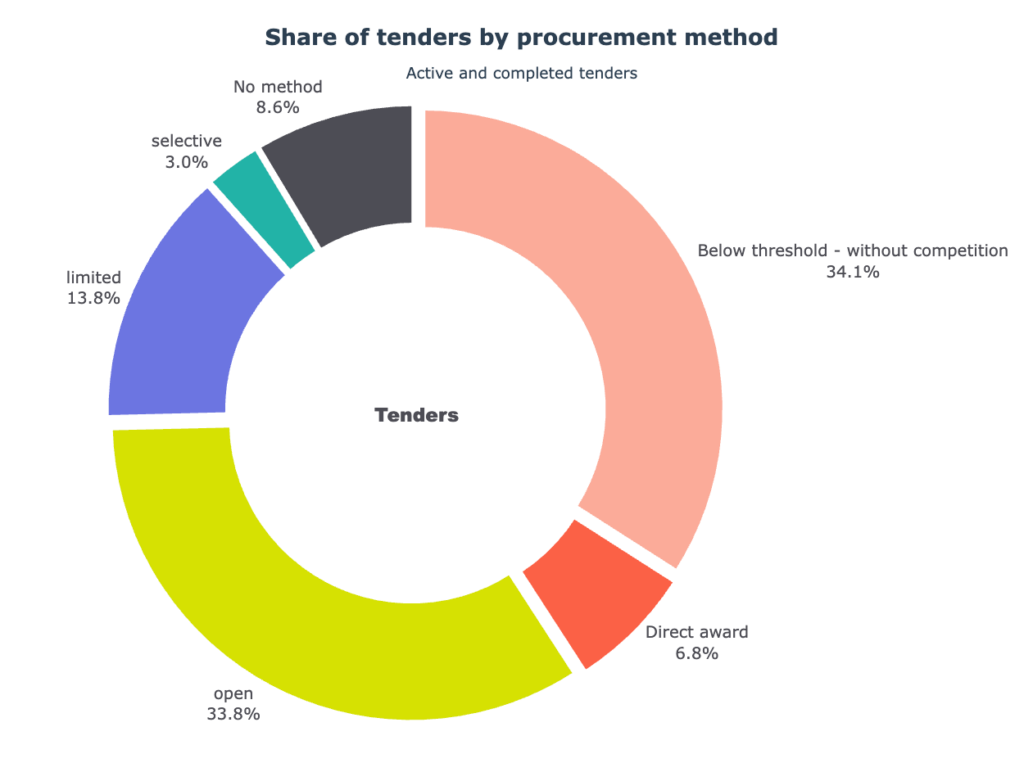
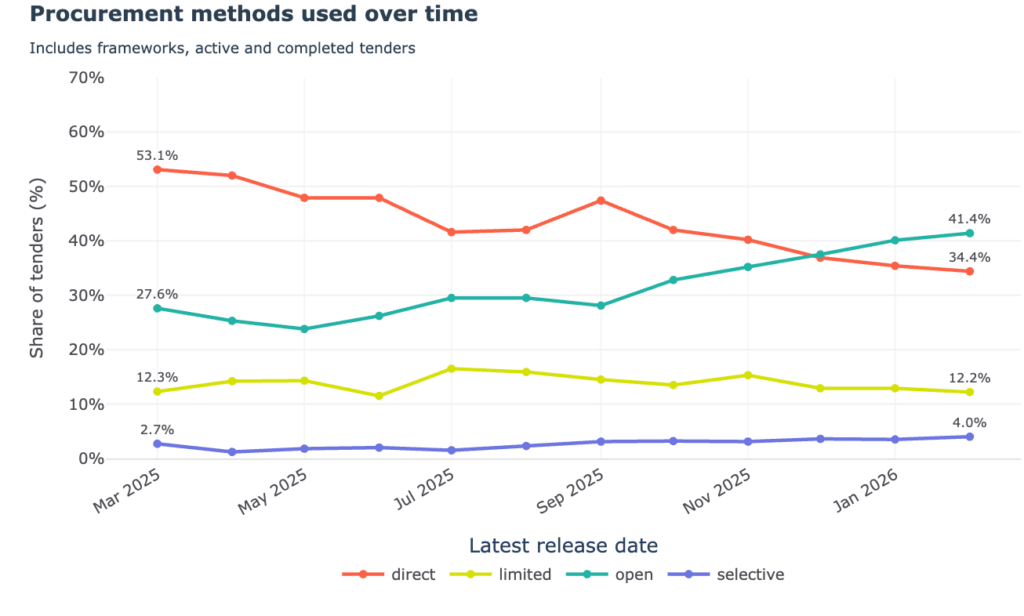
We looked at the number and value of UK procurement procedures. We were surprised to see that uncompetitive direct procedures were the main method used, covering about 41% of total procedures. Open procedures were only about 34% of the total. Selective and limited procedures (often off framework agreements or from a limited pool of suppliers respectively) make up some 17% of procedures. The method used for the remaining 8% was not recorded, an important data quality gap.
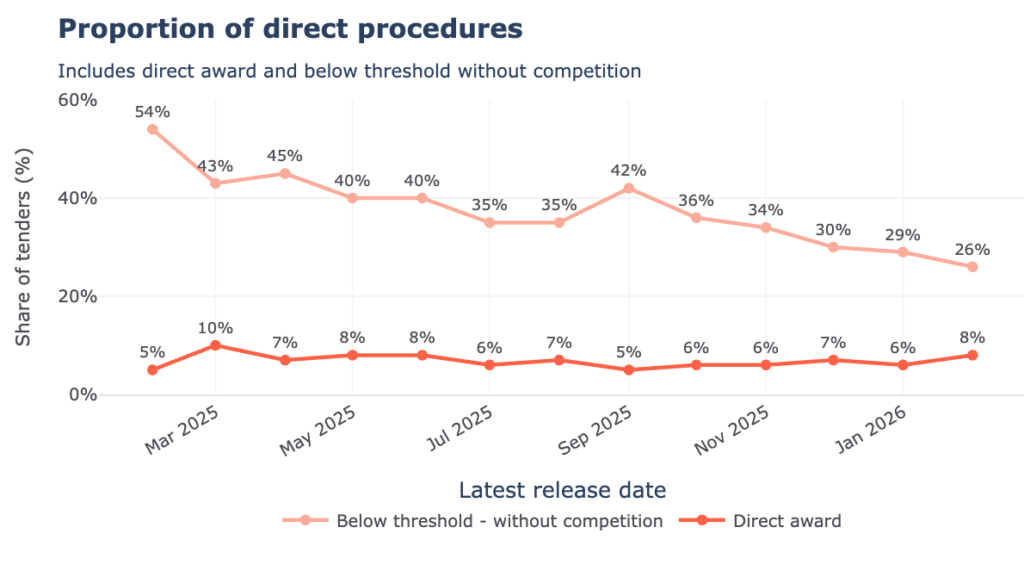
To be fair, most of these direct procedures happen for smaller ‘below threshold’ contracts (the threshold value can vary depending on the type of contract and entity, ranging from less than £139,688 for goods and services, and less than £5,372,609 for a works contract); direct awards for larger contracts are some 7% of total procedures.
The more positive news is that the use of competitive methods is improving. Direct procedures decreased from 53% in March 2025 to 34% in February 2026 (mainly driven by a decrease in below threshold procedures), whereas the use of open tenders increased from 27% in March 2025 to 41% in February 2026. For the last two months, open tendering was the majority method.
This is something to watch closely and important to keep the pressure on encouraging open, competitive tendering across the UK.
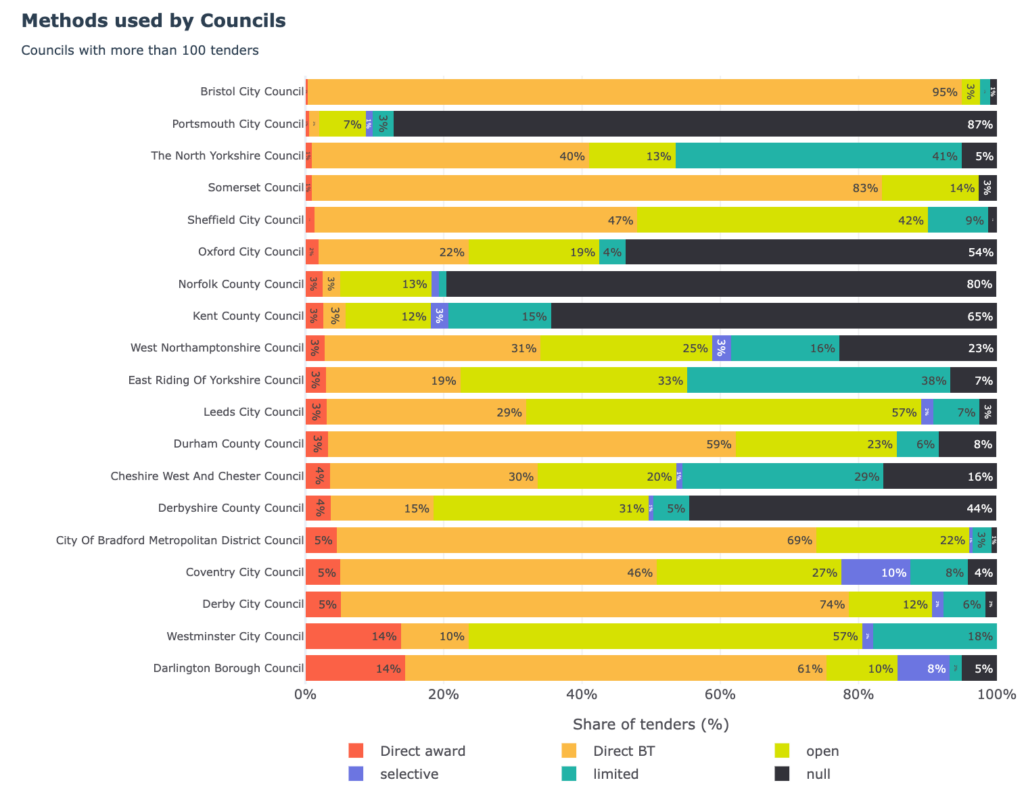
There are significant differences in the use of direct procedures by similar buyers, which suggest there should be more education and encouragement to use open methods.
We compared major English councils with 100+ published tenders. In Bristol, 95% of tenders are below threshold procurement without competition. In Leeds, this method drops to under 30% and open tendering is the norm.
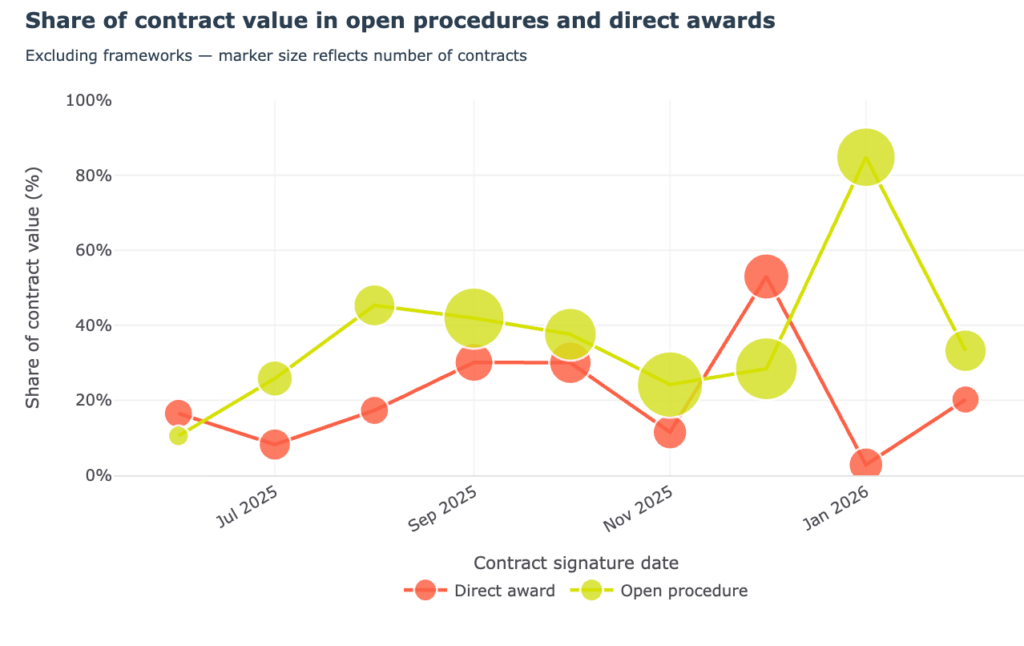
There is better news when we look at the value of tenders by method. Excluding cross-government frameworks, 52% of the value awarded was tendered openly; direct awards (including below threshold) were about 35% by value. We noted that individual, disproportionately high-value direct awards can have a big impact on the relative numbers by month (a recent controversial example being the MOD’s huge direct contract award to Palantir here).
The value of contracts can change after the award so these figures are only provisional. While open frameworks account for a high amount of spending too, these are not considered in the calculation, as contracts often report the full framework value rather than the individual award making estimating the true value here difficult.
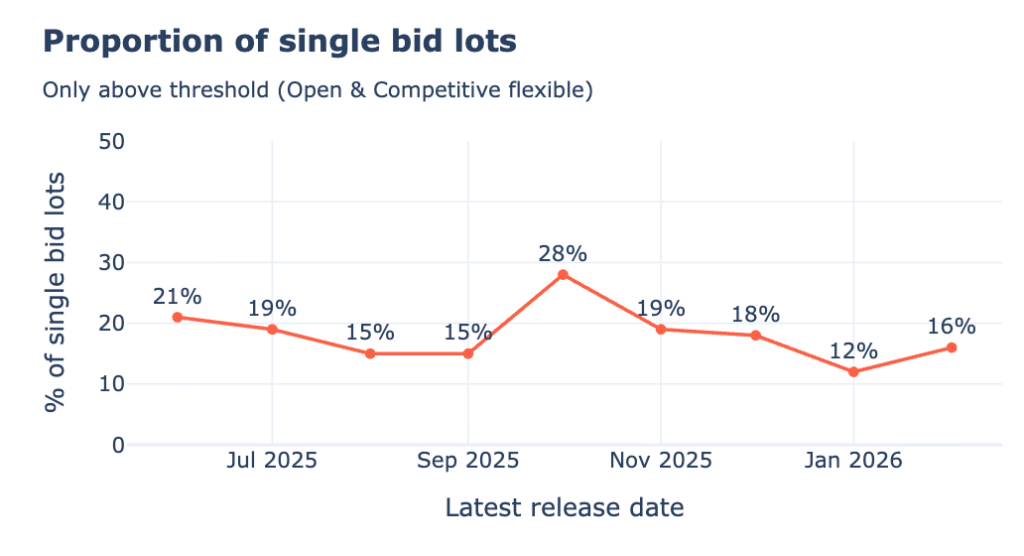
We also saw that the number of single bid lots decreased over the year. Considering above threshold open and competitive flexible procedures, the number of single bid lots has decreased from around 21% as the new regime came in to around 16% of lots now (and whilst the number of open tenders has gone up). Single-bid tenders tend to be approximately 7% more expensive than tenders with more than one bid, so it is important to further improve this. If your tender only attracts one bid, there may be something wrong with your tender, the market or both.
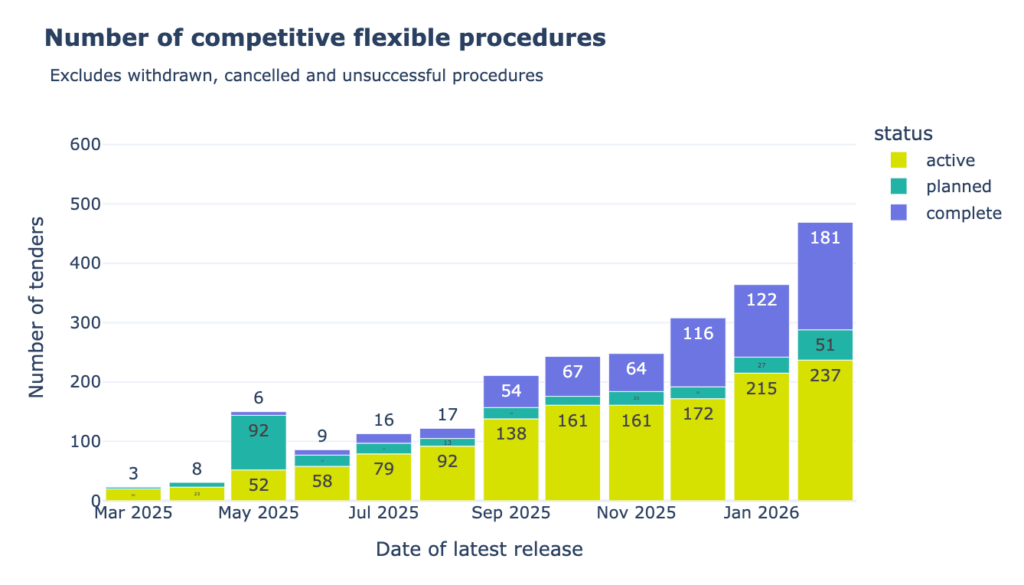
5. Use of the UK’s new competitive flexible procedure rising
One of the important features of the new regime is a competitive flexible procedure designed to encourage innovation and for when selection of suppliers is based around testing and demonstration to achieve an outcome. There were several methods of doing this before but the new regime simplifies the process and actively encourages it.
The UK data shows a steady increase in the use of these to over 400 procedures a month. Competitive flexible selection now makes up almost 15% of tender (UK4) notices by number, but is over 35% by value.
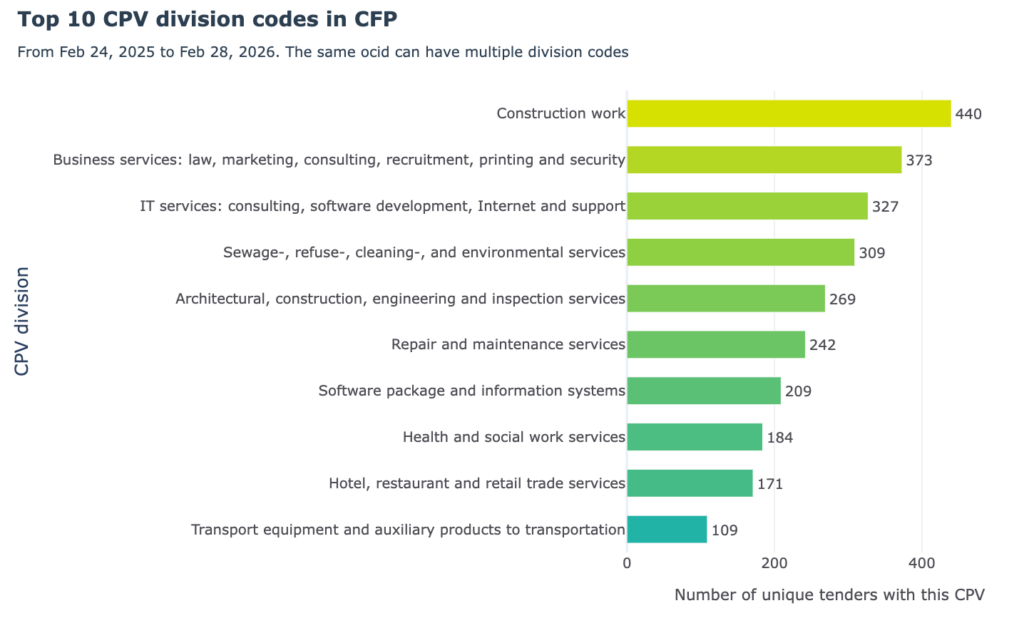
We see competitive flexible approaches being used across every major category of procurement (ie. being used for tenders linked to all 45 Common Procurement Vocabulary categories): the most frequent categories though were construction (11% of items that used a CFP), business services (9%) and IT services (8%).
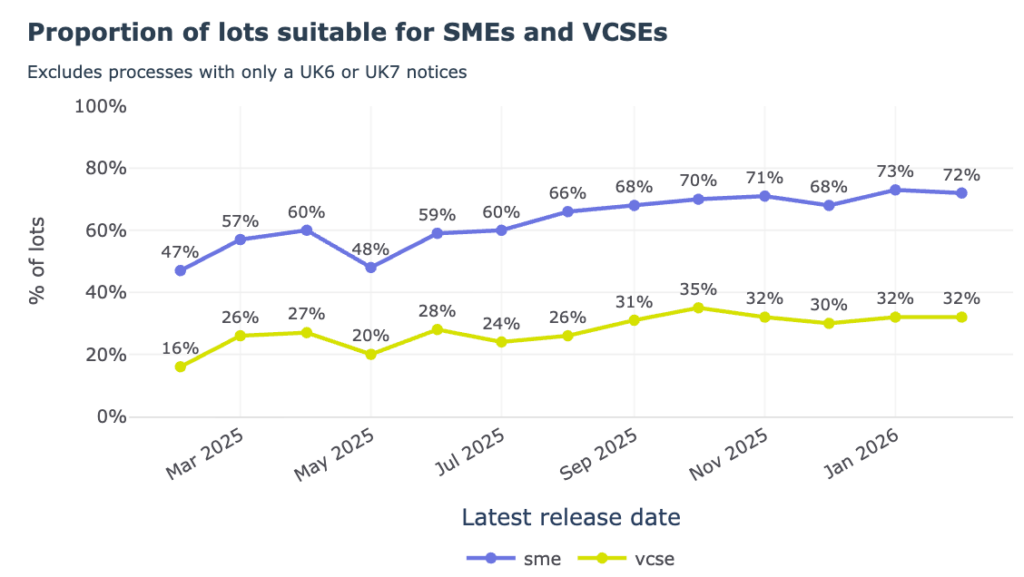
6. Small business engagement is high (more so when there is premarket engagement and when the tender process is open)
Below threshold open competitions can be reserved for SMEs and VSCEs. Currently, we see 6.4% of them are but a rising proportion of lots (from all methods) are being designated as suitable for them (increasing from 57% in March 2025 to 72% in February 2026).
SMEs and VCSE are a consistently high proportion of bidders for tenders, rising from 54% of bids in March to 67% in February 2026.
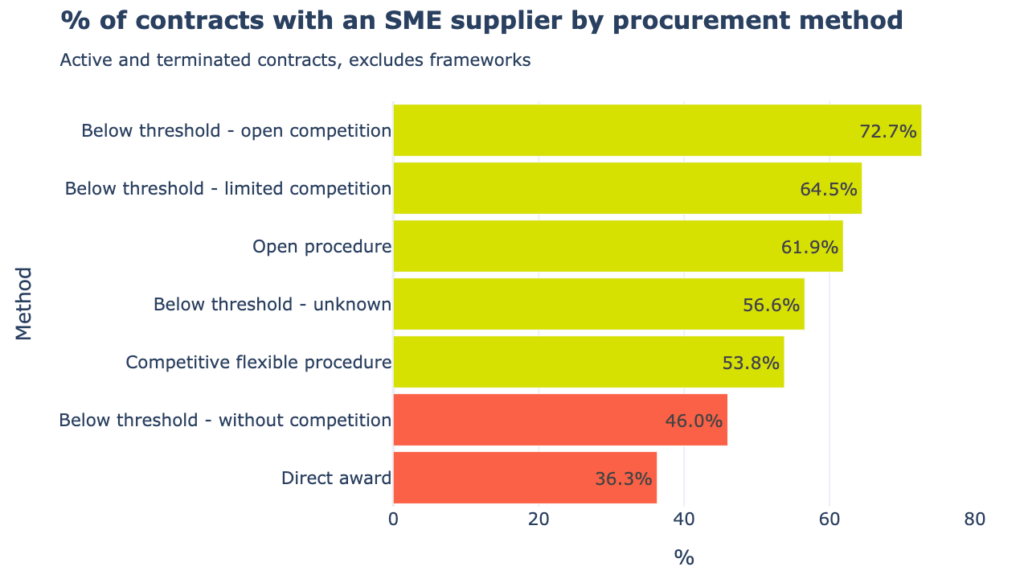
SMEs lose out on direct awards though. The percentage of contracts awarded to at least one SME in open tenders is 61% and reaches 73% in below threshold (i.e. smaller) open competitions. Conversely, only 36% of direct awards and just 46% of below threshold without competition go to SMEs.
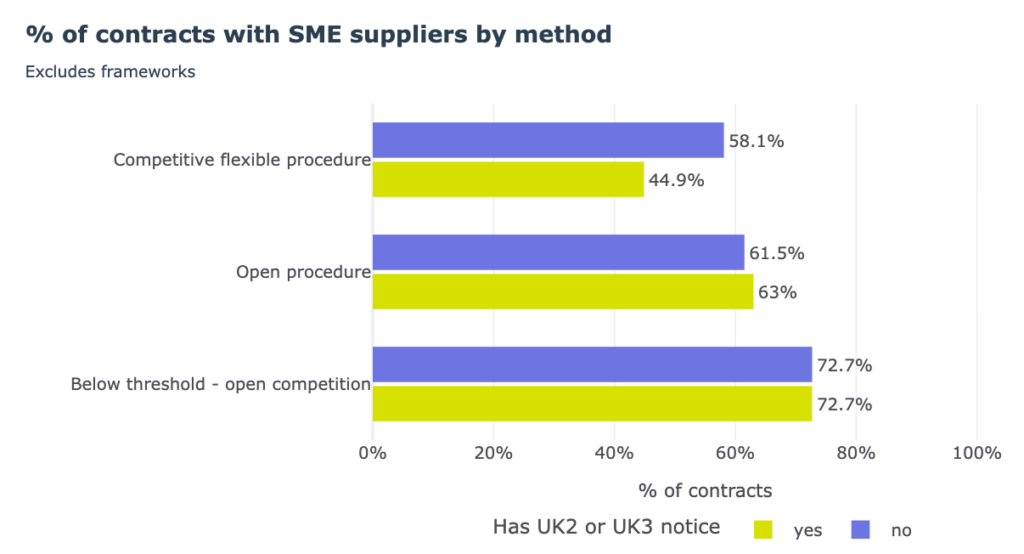
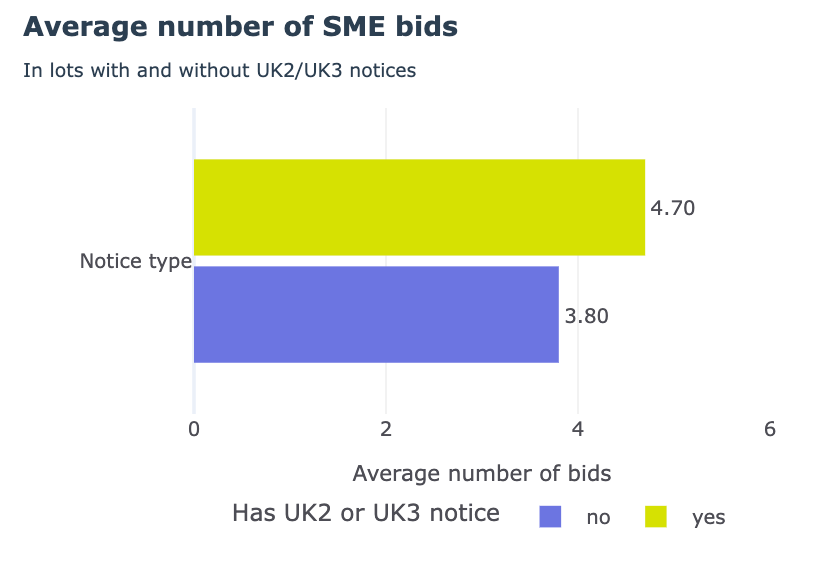
Open tenders with pre-market engagement and/or planned procurement notices show a slightly higher proportion of SME suppliers compared to those without (63% vs 61%). The average number of bids in procedures with UK2 or UK3 notices is also higher (4.7 with vs 3.8 without).
This effect is less with competitive flexible procedures but the rounds of testing and demonstration in them might already be acting as a different way of engaging SMEs.
7. Rising use of quality vs price
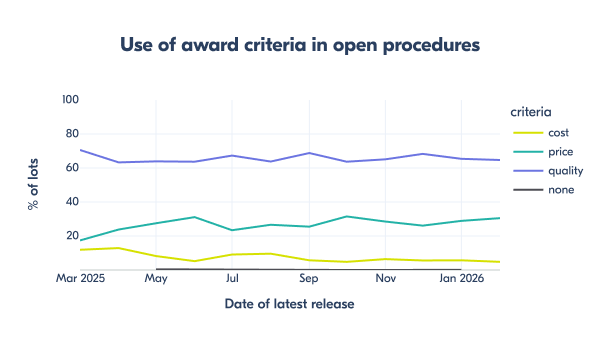
Quality criteria are being used in award decisions in both open and competitive flexible procedures (in 66% and74% of lots respectively).
The pattern was consistent across the year and has not changed much over time even though this was a big change enabled by the law. We need to do a more detailed comparison with the old regime to see how much it changed since then.
Data quality could be improved in how entities declare the weights of the criteria. When a “Description” is selected, all relevant information is stored in a free-text, which makes detailed analysis more complicated. Where there is information on the weighting assigned, quality is the main criteria (more than 50% in weighing), covering 26% of lots.
8. Performance metrics and KPIs in contracts
These are reported as a free text field (in the UK7 notice) so they are not standardised and the data is messy.
Only 4.7% (1,192) of contracts in the dataset currently include them. Considering only contracts above GBP 5 million, the proportion increases to 28% (according to the regulations, many contracts above 5 million GBP should report at least 3 KPIs).
The top mentions where performance metrics are captured are social value, quality, delivery & customer satisfaction.
Social value is the top mention but is often not defined or then includes a very diverse list of things. This will be familiar to many UK social value experts as the current way it is defined is often left to the company to propose, favouring smooth talking larger companies who can offer apprenticeships or glossy environmental, social and governance metrics.
Where should the UK go from here?
Of course, as OCP, we can’t resist giving feedback on how to further improve the data and make it even more useful. And, full disclosure, we are pleased to have a small subcontract with the Cabinet Office and Goaco, the company running the Find a Tender platform, to support further improvements to this end.
I. Improve data modelling and usability
- The UK procurement data is based on our OCDS schema, but the new fields and codelists unique to the UK should also be standardised and documented.
- A ‘data dictionary’ would help users better understand what they are looking at and what each field means.
- Inconsistencies in key fields can be prevented with better guidance on what they are meant to contain and with validation rules that cross-check data or prevent non-entry of important information. This would be especially helpful for the correct use of thresholds and values and in key fields related to award criteria and ‘parties scale field’ (basically the SME field).
- Improve use of organisational identifiers for suppliers. Almost 100% of buyers are using organisational identifiers but usage is much lower for suppliers, particularly in below threshold contracts: some 58% of them do not have a declared identifier.
II. Improve the UX on the new central digital platform.
- Improve navigation between related notices so they are linked and you can step between them.
- Improve keyword search including for CPV codes and for identifiers etc.
- Make the API documentation link visible next to data files and that it is easy to access the original document URL if you want to examine a notice in more detail.
- Support data downloading in flat formats too so users can easily access the data that they need for studying markets and analysing government spending. You don’t have to wait for the Find a Tender platform to fix this: you can already access different formats for the UK and other data on OCP’s data registry page here.
III. Empower Procurers. Finally, but very importantly, we want to see the central platform provide every procurer with their own dashboard, with advanced analytics to track their performance, key contracts and performance data in real-time. The UK deserves a full spec business intelligence machine for all users of procurement information with automated risk and performance indicators. Countries as diverse as Chile, Paraguay, the Dominican Republic, Ukraine and Tanzania all have these – sometimes even supported by UK aid money – so why don’t we have one at home?
We know that this is the future plans of the Cabinet Office team. Once procurers get back their data in useful form, they have more stake in its quality so it’s a virtuous circle and an important part of the plan to take UK procurement to the next level of being a data-driven public service.
Finally, we should close with a caveat: this is our ‘best efforts’ analysis, turned around soon after the year-end. UK procurement data quality is variable and may well have errors. And, as we have said above, the lack of a data dictionary makes analysing and interpreting the data harder.
Nonetheless, the new regime is a major step forward for UK procurement: for the first time, we have a single window on much of UK procurement. It’s especially encouraging to see progress in premarket engagement and SME inclusion and the rise in use of competitive methods.
The full promise of the new regime hinges on addressing the remaining hurdles: data quality, offering better analytics and performance measurement, and tackling the over-reliance on direct awards. The foundation has been laid, but the next critical phase will be to equip every procurer with the tools to translate transparency and insight into better public value as well as the economic innovation and more responsive public services that UK citizens deserve.
Photo: Generated using AI.
This post has been updated on 16 March to clarify that quality criteria are being used in award decisions but we can’t say whether they are the main criterion.
Annex. How we calculated the metrics
If you want to run our analysis, you can download the FTS data from OCP’s Data Registry.
Scope of the data. The analysis was done using the OCDS compiled releases, downloaded from the Find a Tender Service API, with a publication date from February 24, 2025 to February 28, 2026. The dataset was filtered to include only releases corresponding to the New procurement Act (those where the tender/legalBasis/scheme = ‘UKPGA’)
Below we detail the methodologies for the indicators mentioned in this blog (Note: these numbers might differ from official statistics reported by the Cabinet Office, due to different methodologies used):
- Volume of distinct notices published. This counts the number of documents published by notice type, using the fields documents/noticeType that can be found in the planning, tender, awards and contracts objects. Since different versions of the same notice type can be published multiple times in the same procedure and recorded as a separate document, this indicator counts a single notice type per procedure (ocid) for notices UK1, UK2, UK3, UK4, UK12, UK13, UK14, UK16. For instance, procedure ocds-h6vhtk-04e781 has 3 versions of a UK3 notice, so this is counted only once. For UK5 and UK6, for each award, if multiple versions of the same notice type are published (with distinct ids), only the latest is considered. Then, since the same UK5 or UK6 notice can be linked to multiple awards, the number of distinct notices is calculated by counting the distinct documents/id. For instance, the procedure ocds-h6vhtk-04fb96, one award has multiple UK6 notices, but only one is counted, and in procedure ocds-h6vhtk-04e851, the same UK6 notice is linked to multiple awards, so this is only counted once. Similarly, for UK7 and UK11 notices, if multiple notices are published in the same contract, only the latest is considered. Then, since the same UK7 notice can be linked to multiple contracts, the number of distinct notices is calculated by counting the distinct documents/id. For notices UK15, UK10, the distinct documents/id is counted as for the same procedure and contract, you can have multiple modifications.
- Volume of Pre market engagement notices (PME) and Planned procurement notices (PPN). Counts the number of UK3 and UK2 notices published by procedure. It uses the latest publication date (documents/datePublished), as the same notice type can be published multiple times in the same procedure and recorded as a separate document.
- Number of procedures published by method over time. Counts the number of tenders (with a status active or complete) by procurement method (tender/procurementMethod and tender/procurementMethodDetails). Frameworks are included in this count. For the time period, it uses the release date field, from the compiled release, which shows the latest release date.
- Total value by method. Sums the contracts/value/amountGross by procurement method (tender/procurementMethod and tender/procurementMethodDetails) in contracts with a contracts/status “active” or “terminated”. It only considers contracts with contracts/value/currency = “GBP”. It excludes contracts with framework agreements. For the date period id uses the contracts/dateSigned field.
- Proportion of single bid lots. Counts the number of lots that received a single bid (where bids/measure = “finalStageBids” and bids/value=1) divided by the total number of lots. Considers only bids related to tenders with a tender/status “active” or “complete” and lots where the tender/procurementMethodDetails = ‘Competitive flexible procedure’ or ‘Open procedure’.
- Volume of competitive flexible procedures. Counts the number of tenders where tender/procurementMethodDetails = ‘Competitive flexible procedure’ and where the tender/status != (‘withdrawn’, ‘cancelled’, ‘unsuccessful’). It includes above and below threshold procedures. For the time period, it uses the release date field, from the compiled release, which shows the latest release date.
- Items using competitive flexible procedures. Counts for each item procured (tender/item/additionalClassifications/id) using a Competitive Flexible procedure, how many distinct ocids it has. A single procedure can have multiple item classifications (CPV codes). For this count the CPV division code (first 2 digits) is used.
- Reservation for SMEs. Count of the total number of tenders where tender/procurementMethodDetails = ‘Below threshold – open competition’ and tender/otherRequirements/reservedParticipation = ‘smeVcse’, divided by the number of below threshold – open competition tenders that are active or complete. Only these procedures are considered, as in the New Procurement Act, only these procedures can be reserved.
- Proportion of lots suitable for SMEs and VCSEs. Counts lots where tender/lots/suitability/sme = true and tender/lots/suitability/vcse = true for procedures that have either a UK1 or UK2 or UK3 or UK4 or UK5 or UK 13 or UK15 Notice Published. Procedures that only have a UK6 or UK7 notice are not included as the suitability field is not available for these. For the time period it uses the release date field, from the compiled release, which shows the latest release date.
- Proportion of bids by SMEs. Counts the number of SME bids received (bids/value) in lots where bids/measure = ‘smeFinalStageBids’ divided by the total number of bids (bids/measure = ‘FinalStageBids’). Considers only bids related to tenders with a tender/status “active” or “complete”.
- % of contracts with an SME supplier by procurement method. Counts the number of contracts with at least one supplier declared as an SME (party/details/scale = ‘sme’). It considers only active and terminated contracts and excludes frameworks from the calculation. Note: there are some data quality issues identified, including cases where the same supplier, using declared and not declared identifiers in the same procedure have conflicting values in the parties scale field. In these cases, if there was an SME tag, it was considered as an SME.
- % of lots by award criteria. Counts the frequency of the award criteria type (tender/lots/awardCriteria/criteria/type) used in procedures with a UK4 tender notice. A single lot can have multiple criteria. In the cases where the criteria weights were assigned (tender/lots/awardCriteria/criteria/numbers/number), if the percentage assigned to quality was higher than 50%, the quality criteria is considered as the main award criteria for that lot.
- Contracts with performance metrics. Count of contracts that have performance metrics (where contracts/agreedMetrics is present). The proportion is calculated for all contracts and for those with a gross amount above GBP 5 million.
If you have any questions on the data or the metrics, please reach to [email protected].