Follow the water: Using open contracting data to evaluate the cost-effectiveness of flood management in Taiwan

Taiwan is full of typhoons, and increasingly, heavy torrential rains. In the last decade, there has been an average of eight critical floods per year. For example, on August 23, 2018, an extreme rain brought over 600-mm of precipitation. Seven people were killed and more than 100 were injured. In addition, nearly 7,000 people had been evacuated and 70,000 households suffered from power outage.
Over the years, the government has spent a significant amount of money in flood management, nearly NT$180bn (US$6bn) since 2006 and has committed an additional NT$250bn (US$8.4bn) before 2024. Billions of dollars and thousands of projects later, mostly in the form of construction projects, we would like to ask a simple question: has the government done a good job and has the public money been spent where it was needed the most?
The investigation

A social innovation hackathon organized by the Presidential Office of Taiwan to seek solutions to societal problems through the use of open data provided the perfect springboard to dive into the data.
During the three-month competition (yes, it was a marathon, not just a one-weekend sprint), a team of computer engineers, data scientists, civil engineering researchers, and journalists worked together to:
- Understand the flood patterns
- Identify flood causes
- Understand the government procurement patterns
- Compare flood hotspots with construction project values and locations
- Measure the suitability of these projects
- Evaluate the cost-effectiveness of these projects
Diving into the data
First, the team looked at the different data needed to respond to our question, including data on floods, as well as the data on procurement. The hackathon proved helpful to access never-before-published raw data behind historical flood reports via the organizer.
The second key dataset included awards related to water resource management or flood management from a web-scraping project by other civic hackers, mostly construction projects.
However, the data quality was not as good as the team hoped.
After examining the procurement data, the team realized that some key information was missing from the construction projects, such as:
- Construction methods
- Exact location (no latitude/longitude, only the vicinity such as city or county)
- Project evaluation benchmark (for example, if an embankment can hold the peak streamflow from a 100-year flood).
Similar problems occurred in the flood data. The details of each flood, such as the cause, was not well-documented.
Flood patterns
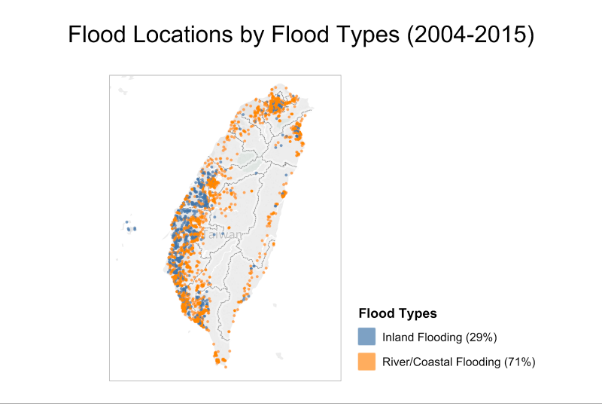
First of all, the team plotted the location for each flood on a map. Thousands of locations between 2004 and 2015. The team also tried to identify the causes of floods and find a way to tell if a flood was caused by river-(or ocean) flooding or sewer flooding.
However, due to the lack of detailed information regarding each flood, they eventually adopted a simple, quick-and-dirty method: if a flood’s location was close to a river or the coastline (say, within 1 km), the team would label the flood as “river/coastal flooding”. If a flood occurred in a dwelling area and the distance to the nearest river was farther than 1 km, it would be labeled as “inland flooding”.
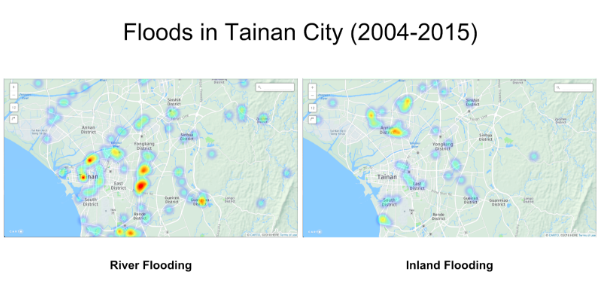
The team then created heatmaps of impact based on the two flood causes. The following example is Tainan, a city with a population of 1.8 million.
Procurement patterns
The procurement data contained geolocational information, in the form of “city/county”, so that the team was able to count the number and value of construction projects in each city over the years.
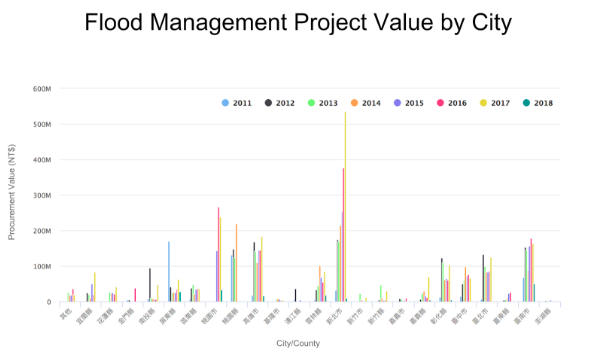
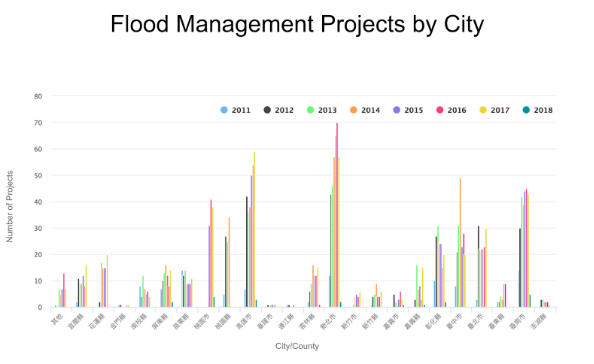
The team noticed an uneven distribution of government spending. Some cities awarded a large amount of money every year, and some, very little.
The team continued its investigation to see if this procurement trend was related to the degree of flood risk.
Connecting the dots between flood and procurement patterns
The geolocational information in both datasets was different: the flood data is stored in “point” data type, i.e., the latitude and longitude of each flood and the procurement data was recorded as an “area”, i.e., cities, counties or villages. For the purpose of this analysis, the team decided to use the area as the common dataset writing some code to assign each flood location to a city or village.
The emerging results
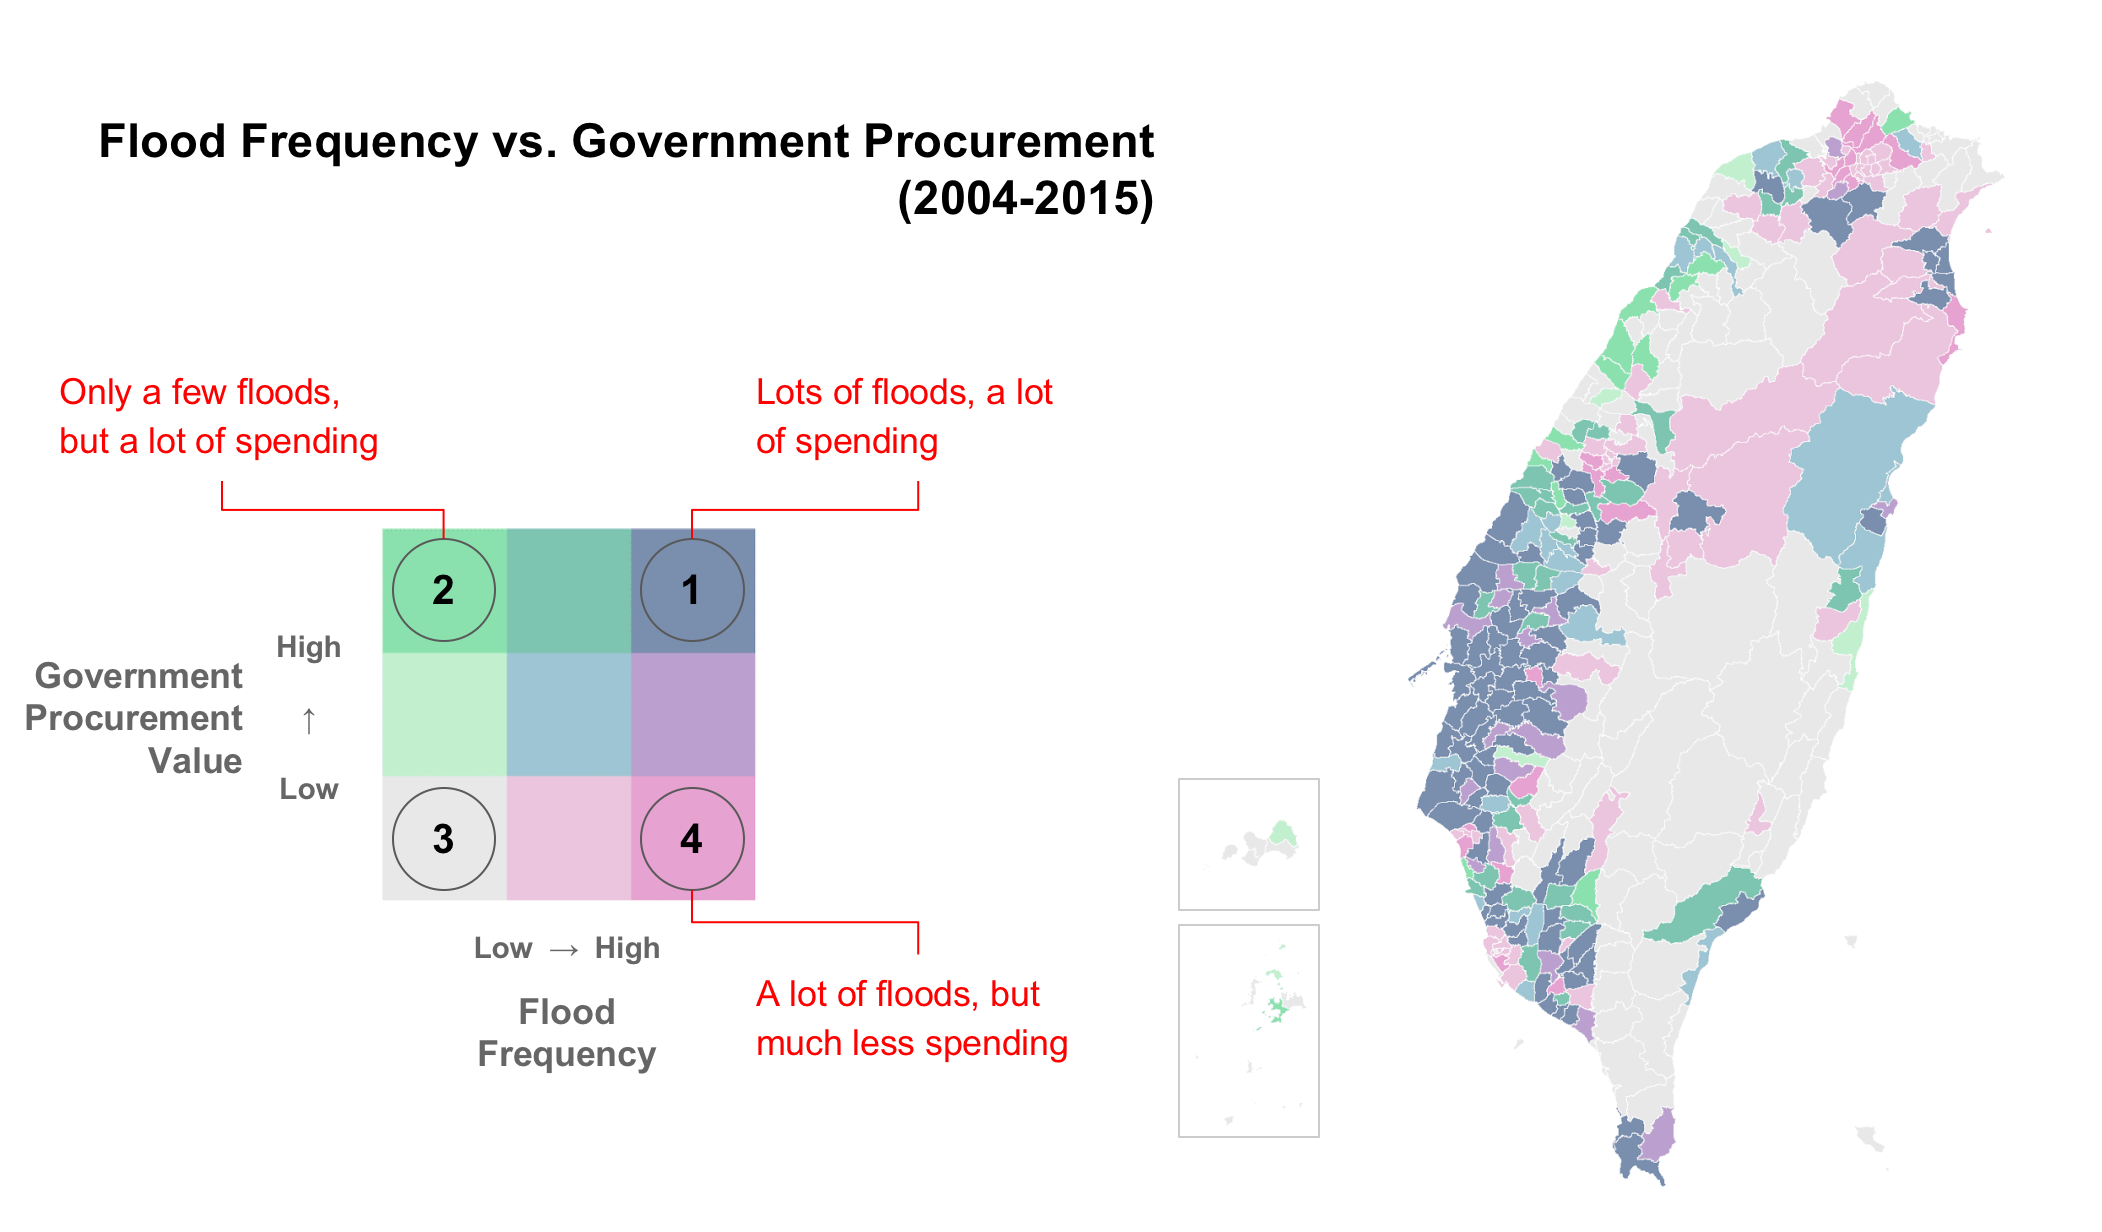
The team identified three types of pattern that require further investigation.
Lots of floods and a lot of spending (dark blue, top-right)
These areas see lots of floods and a lot of spending.
Some of the related questions the team asked: Have the contractors applied the optimal construction methods to manage water resources and control floods? And if they did, why did the floods keep occurring? Is it due to human error, or are the floods simply too powerful? And finally, are there any public audit reports, so that we can better understand the projects.
If the best construction methods were applied and the floods just kept occurring, one can’t help but ask: should we keep fighting the water head-on in these regions?
Few floods, lots of spending (green, top-left)
These regions are characterized by only a few floods, but a lot of spending, posing the key question why are the flood risk and government spending are, relatively speaking, out of proportion?
Is it that because they were located in the upstream area or rather because of the gap in regional development between the east and the west?
It might be because of a different government decision on whether to spend more or spend less on flood management independent of the flood risk level. Some of these regions are one-time victims of an extreme typhoon. It could imply an oversized disaster recovery plan covering a lot of projects across a relatively short period of time.
Lots of floods, little spending (pink, bottom-right)
These regions tend to be the less populated areas in Taiwan that see a lot of floods, but much less spending. Could population density be a determinant factor for budget allocation?
If so, did the government consider the interaction between terrain and rain on a larger scale, such as upstream mountains and downstream urban areas?
Conclusions
Because of the time constraint, data availability and a lack of a commonly accepted definition for project performance, the team was not able to appropriately evaluate the suitability of these projects and the cost-effectiveness.
However, in Taiwan, it was probably the first time that a data-driven approach was applied to water resource management, as opposed to civil or environmental engineering methods.
This small, investigative project born from the Presidential Hackathon, although rough and incomplete, is a proof of concept that government procurement data can be used for examining the water resource management projects.
With more information about construction project details, such as engineering methods, exact project locations, and project outcomes, it would be possible to develop scalable measures for project suitability and cost-effectiveness.
For other countries, we hope this project can serve as an example of using open contracting data to examine critical areas of public investment, such as we did in analyzing the performance of flood management projects.