Targeting extreme heat: Using open data to prioritize disaster spending in India

As members of our team attended London Climate Action Week, the severe heatwaves that swept across Europe were a stark reminder of how urgently effective climate resilience solutions are needed. Extreme heat is now one of the most dangerous climate risks worldwide, linked to nearly half a million deaths each year. Yet heat remains invisible in the way governments manage disasters. It arrives without the visual drama of a flood or storm, and its victims often go uncounted.
In India, where heat-related deaths are projected to rise sharply by the end of the century, a national finance commission recently called for heat and lightning to be classified as extreme weather events. It’s a policy shift that could bring more investment and strategic coordination to a problem that has long had too little of either.
But resources are only useful if there are systems to make sure they reach the most vulnerable. Authorities need to know where heat hits hardest, who is most exposed, and how the funds are used. That’s the gap our Intelligent Data Solution for Disaster Risk Reduction (IDS-DRR) is designed to minimize. Developed by the Open Contracting Partnership and CivicDataLab, in consultation with experts and local officials, IDS-DRR was first built to manage spending to reduce flood risks and has now been extended to cover heat – bringing scattered data together so governments can shift from reactive disaster response to proactive, data-driven climate preparedness.
A ‘silent killer’
Part of the problem is a historical one-size-fits-all approach to heat management. In India, national mandates traditionally trigger heatwave protocols only when temperatures exceed 40 degrees Celsius, a national threshold that flattens enormous regional differences.
In the northeastern state of Assam, the mercury rarely climbs that high, so official heatwave days are almost never triggered. Yet, the region has warmed significantly, and at least eight heat-related deaths were officially reported between 2024 and 2025. Without a formal declaration, local officials often lack the authority to deploy emergency resources.
In the eastern coastal state of Odisha, meanwhile, temperatures regularly exceed 42 degrees Celsius, but it is the humidity that does the damage, causing physiological strain that a thermometer alone cannot capture.
The health toll is just as hard to pin down. When someone with a heart condition dies during a hot spell, authorities can seldom draw a clean line back to the temperature. The deaths accumulate quietly, which is part of why heat so rarely earns a budget of its own in disaster risk reduction planning.
Mapping the risk and following the money
IDS-DRR integrates large volumes of previously fragmented data to map where heat and vulnerability risks are the highest and how government money is being spent to combat them. The platform is already in use for flood risks in three states: Assam, Himachal Pradesh and Odisha. Now, we are extending it to cover heat in all districts of Assam and Odisha. The platform relies on unlocking various types of data, including hazard metrics, vulnerability indicators and public procurement records. (At the time of writing, the heat risk analytics are live on a private version of the platform with the aim to launch publicly in collaboration with our government partners.)
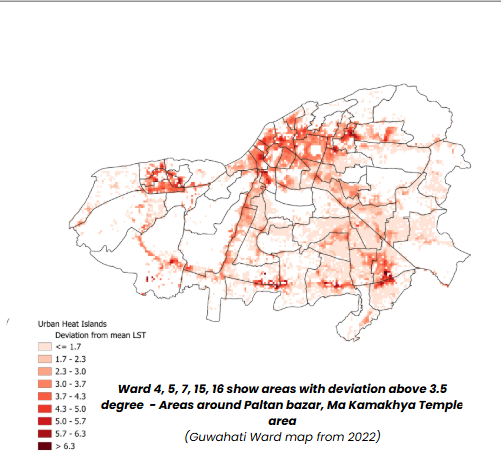
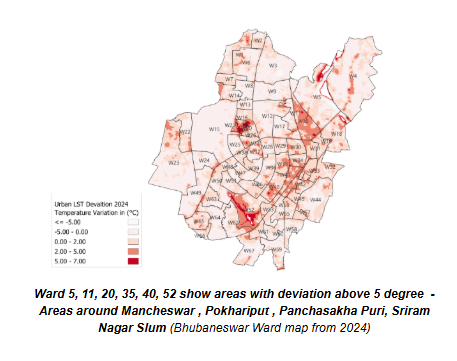
The data aggregated so far can be used to calculate objective indicators of heat risk at the district level (see Table 1), based on the Intergovernmental Panel on Climate Change (IPCC) Framework. Among the datasets are 20 years of land surface temperature data, which we transformed from satellite imagery into an accessible format. Eventually, we plan to offer more granular analysis at the ward level, where the “urban heat island” effect can be observed: concrete surfaces, dense urban infrastructure, and limited green cover trap heat, driving local temperatures well above their surroundings. We have already produced static maps of this kind for the cities of Guwahati and Bhubaneswar.
Figure 1. Urban heat island maps for Guwahati and Bhubaneswar
 |  |
| Guwahati | Bhubaneswar |
Mapping heat, however, is only half the battle. The platform also scrapes public procurement portals to see where the government is investing money. Unlike flooding, “extreme heat” rarely has a budget of its own, so responses are often buried across different departments. Much of it never shows up in tendering data at all, because heat interventions are often ad-hoc and don’t require major construction. For example, if a local government turns a school into a makeshift cooling center over the summer holidays, that is an administrative decision that doesn’t require a procurement process.
Figure 2. Heat-related tenders identified in Odisha, April 2021 to May 2026, group by response category
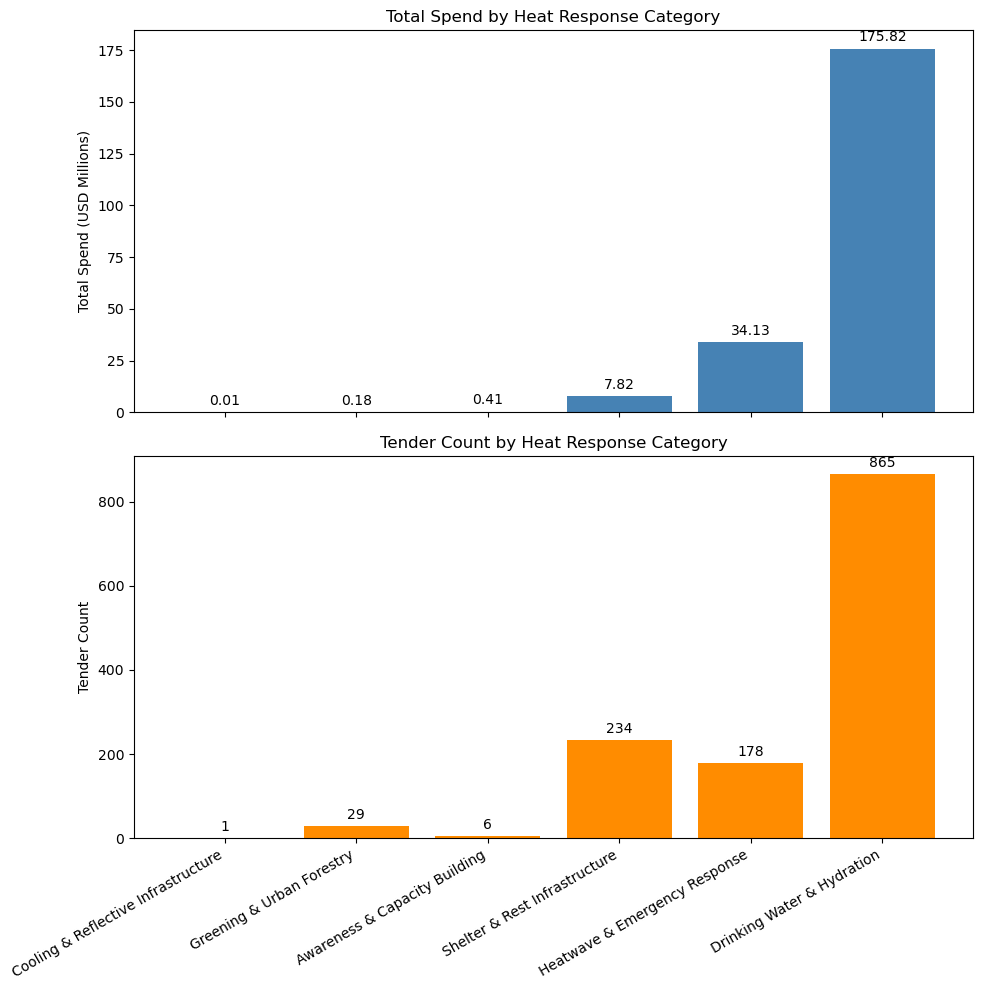
To find these hidden expenditures, IDS-DRR casts a wide net with customized algorithms. In Odisha alone, we identified and tagged 1,313 heat-related tenders worth US$ 218 million as of May 2026. Many had another primary purpose but addressed heat indirectly; for example, a forestry department plantation project improves green cover, which in turn lowers air and surface temperatures.
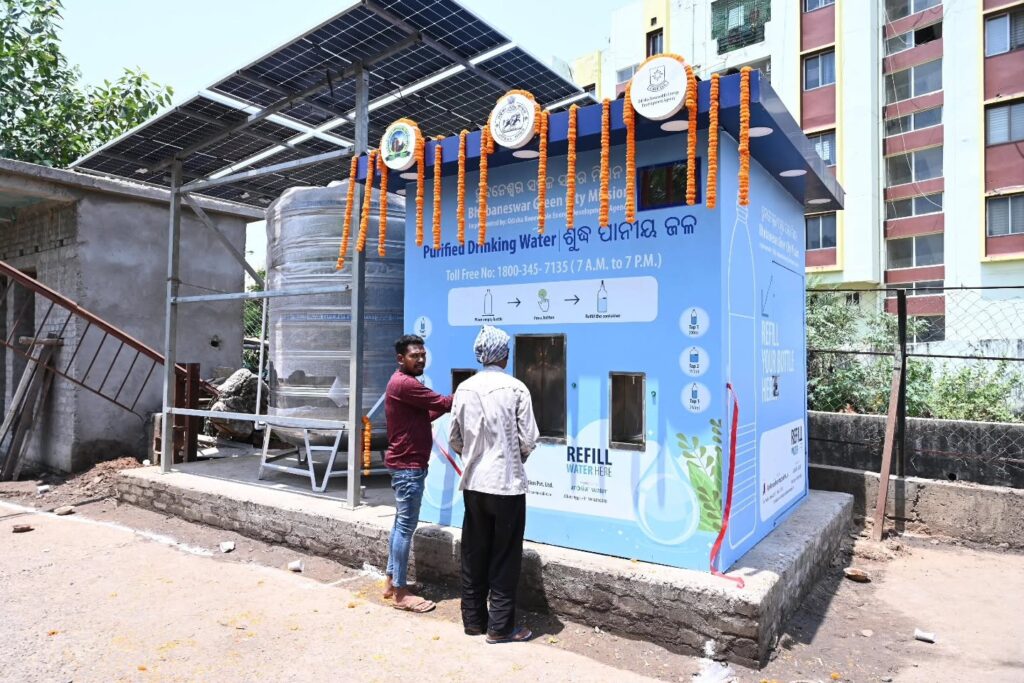
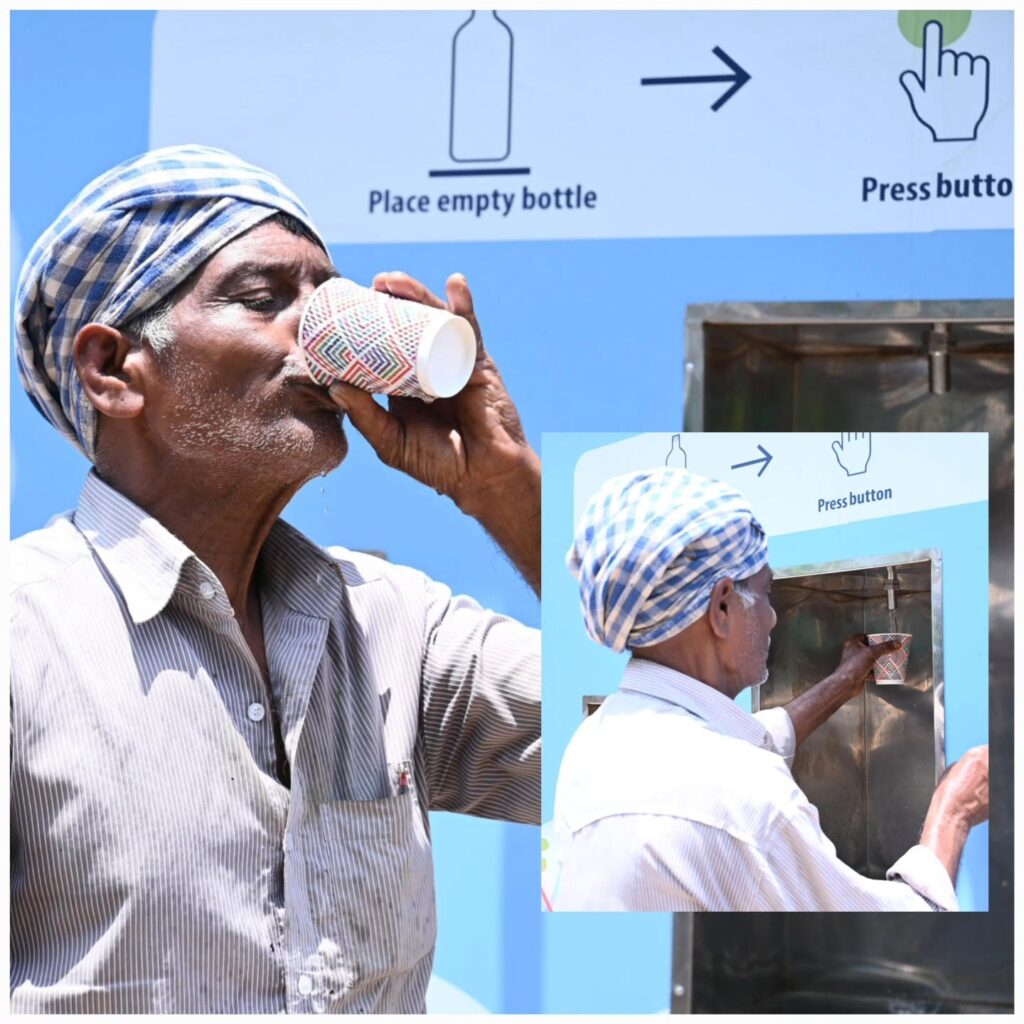
Only seven tenders in Odisha, awarded between May and August 2025, explicitly mentioned heatwaves and extreme heat. All were for temporary sheds beside traffic junctions. Another 14 tenders, from May 2025 to June 2026, were for constructing drinking water kiosks in public spaces. All these tenders were carried out in the summer months, suggesting they are emergency measures to deal with ongoing heatwaves. The 10 largest tenders by value, all from 2021, were for upgrades to drinking water supply systems in major cities.
From ad-hoc relief to targeted resilience
Overlaying this financial data with other indicators – such as population density, healthcare access, and the presence of outdoor laborers – lets decision-makers assess risks at a hyper-local risk level.
The approach has already proved itself. When IDS-DRR was first deployed to tackle flooding in Assam, it helped state disaster management authorities identify 10 high-risk districts. Armed with a data-driven justification for resources, officials prioritized seven of those 10 districts with targeted budgets and project approvals in 2025.
For heat, the platform’s dashboards can play the same role: showing disaster management officials how risk has evolved in specific districts and where the local coping capacity falls short, to guide interventions and resource allocation decisions.
What the heat model shows in Assam and Odisha
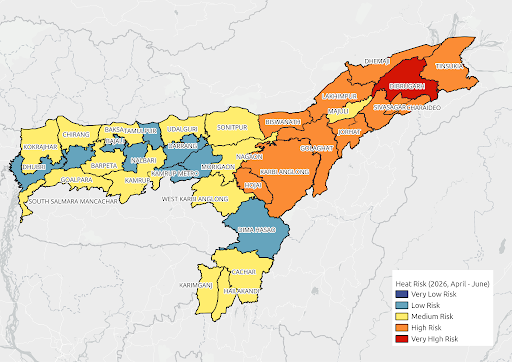
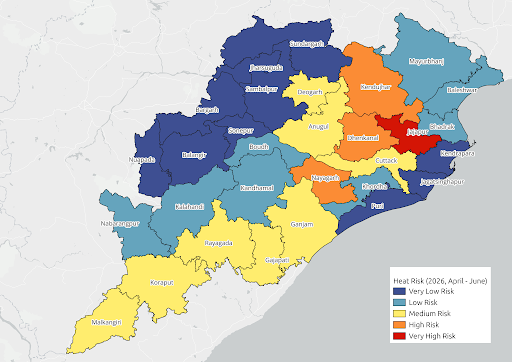
Figure 2. District-level composite heat risk for Odisha and Assam, summer 2026 (April to June)
 |  |
| Assam | Odisha |
Using the IDS-DRR model, we analyzed heat risks across the districts of Assam and Odisha during the 2025 and 2026 summer seasons (April–June). In Assam, Sonitpur was the only very-high-risk district in summer 2025, with 11 others – Biswanath, Dibrugarh, Goalpara, Golaghat, Hojai, Karbi Anglong, Lakhimpur, Nagaon, Tinsukia, Udalguri and West Karbi Anglong – classified as high risk. In summer 2026, Dibrugarh was the only very high-risk district, while Biswanath, Charaideo, Dhemaji, Golaghat, Hojai, Jorhat, Karbi Anglong, Lakhimpur, Sivasagar and Tinsukia remained high risk (see Figure 2). Sonitpur dropped out of the very-high-risk category in 2026 mainly due to a decline in extreme heat days, from 26.63 days in 2025 to 11.73 in 2026. This lowered the heat hazard, while exposure and vulnerability risks remained stable. Dibrugarh became the highest-risk district in 2026 because it had the highest number of extreme heat days in the state.
In Odisha, eight districts – Balangir, Bargarh, Boudh, Cuttack, Jajapur, Kalahandi, Kendujhar and Sonepur – were classified as high risk in summer 2025, while no districts were very high risk. In summer 2026, Jajapur became the only very-high-risk district, driven by a rise in extreme heat days (68 days in total). This intensified heat hazard, along with persistently elevated exposure and vulnerability risks, increased the district’s composite risk score. Meanwhile, Dhenkanal, Kendujhar and Nayagarh were classified as high risk (see Figure 2).
Across both states, the single biggest driver of a district’s overall heat risk was the number of extreme heat days, which accounted for roughly 50–67% of the composite risk score in most higher-risk districts. But districts with similar heat hazard can carry very different risks overall, due to variations in vulnerability. For example, in Jajapur and Kalahandi in Odisha, and in Hojai, Tinsukia and Udalguri in Assam, vulnerability indicator scores contributed significantly to overall heat risk (25-37%). This suggests that underlying sensitivities substantially amplify the danger. Conversely, districts with relatively high exposure but lower vulnerability, such as Mayurbhanj and Cachar, ranked low or medium risk, showing exposure alone does not drive risk.
These findings indicate that although the main driver of heat risk is climatic hazard (e.g. heatwaves), it is the interaction between hazard and vulnerability that ultimately makes a district “risky” – and that interplay is what makes the model useful for prioritizing district-specific heat adaptation interventions and resource allocation.
Complement, consult and collaborate
For anyone attempting to replicate this approach, our advice is to map the stakeholder ecosystem first and find where you can add value to work already underway. For example, in Assam, the demand to monitor extreme heat came from state officials, who were developing the state’s policy for heat amid growing recognition of its harmful impacts.
The Assam State Disaster Management Authority (ASDMA) had collaborated with us in developing the initial flood risk analytics module of IDS-DRR, and were using its insights to shape their flood management. This partnership offered a unique opportunity to adapt IDS-DRR to inform the state’s heat action plan to be responsive to hyper-local needs whilst building on the national framework.
With backing from the disaster management leaders who oversee statewide resource allocation, planning, and reporting, the team could take on more ambitious work, from opening and integrating new government datasets to developing heat risk analytics and procurement intelligence.
Our team also helped establish the Assam Heat Action Alliance (AHAA), a multi-stakeholder forum that brings together ASDMA, UNICEF, government departments, civil society organizations, and academic institutions to coordinate heat action. In a state without a dedicated heat taskforce, this alliance seeks to break down silos, enabling government departments, technical institutions and civil society organizations to work together to develop a strategic and coordinated plan to combat heat. AHAA will also help district and local bodies to develop localized heat action plans, heat vulnerability assessments, early warning communication systems, and interventions to better protect the most vulnerable people from increasingly dangerous temperatures.
Meanwhile, Odisha needed something different. The state faces multiple disasters each year, and it already has a heat action plan and advanced technology in place. What it lacked was a way to reach communities effectively. That was the gap we chose to address.
A blueprint for a scalable solution
The implications of this project reach well beyond India. We are working to have IDS-DRR recognized as a Digital Public Good (DPG) for managing flood risks and spending, which would make its underlying architecture easier for other countries to adopt.
The successful integration of heat-risk analytics shows the platform has the flexibility to add new hazards and datasets over time – drought, landslides, cloudbursts – giving disaster management authorities a single decision-support system with integrated risk insights for multiple climate hazards.
As temperatures continue to climb around the world, India’s data-driven experiment offers a vital lesson: fighting climate change is as much about improving knowledge and coordination as it is about reducing emissions.
Table 1: Datasets used to measure extreme heat risk at the district level (based on IPCC framework)
| Factor | Indicator | Dataset | Relevance |
|---|---|---|---|
| Hazard | Extreme heat days | ERA5 | Meteorological factor |
| Land surface temperature | MODIS | ||
| Exposure | Population density | WorldPop | Population under stress |
| Vulnerability/Sensitivity | Proportion of children | WorldPop | Immature bodies |
| Proportion of elderly | WorldPop | Vulnerable bodies | |
| Pregnant women | Antodaya | Vulnerable bodies | |
| Sex ratio | WorldPop | Gender dynamics | |
| Persons with disability | NFHS-5 | Susceptible people | |
| Pre-existing non-communicable diseases | NFHS-5 | Susceptible people | |
| Labor population exposed to the sun (as per NIC codes) | PLFS, 2025 | Exposure to outdoor work | |
| Coping Capacity | Healthcare centers | Bharat Maps | Medical capacity |
| Piped tap water | Antodaya | Rehydration | |
| Government Response | Heat-related tenders | State E-Procurement Portal (GEPNIC) | Government funds |
We would like to thank the Patrick J. McGovern Foundation (PJMF) for its generous support in making this work possible. PJMF is a philanthropic organization dedicated to advancing artificial intelligence and data science solutions to create a thriving, equitable, and sustainable future for all.


